
Datadog Jobs Monitoring
by Spark & Databricks job optimization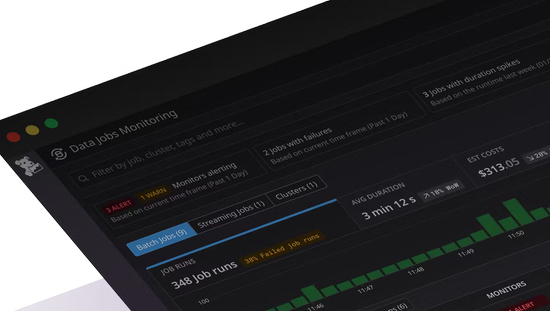

Centralize data workloads in a single place
$0.00/month
Datadog Jobs Monitoring (DJM) helps data platform teams and data engineers detect problematic Spark and Databricks jobs anywhere in their data pipelines, remediate failed and long-running jobs faster, and proactively optimize overprovisioned compute resources to reduce costs. Unlike traditional infrastructure monitoring tools, native interfaces, and log analysis, DJM is the only solution that enables teams to drill down into job execution traces at the Spark stage and task level to quickly resolve issues and seamlessly correlate their job telemetry to their cloud infrastructure—in context with the rest of their data stack.
Top Features
Detect problematic jobs
Detect job failures and latency spikes anywhere in your data pipelines.
Resolve failures & latency
Pinpoint and resolve failed and long-running jobs faster.
Cost-optimize clusters & jobs
Reduce costs by optimizing misallocated clusters and inefficient jobs.
Centralize data pipeline visibility
Centralize data pipeline visibility with the rest of your cloud infrastructure.
Recommended products


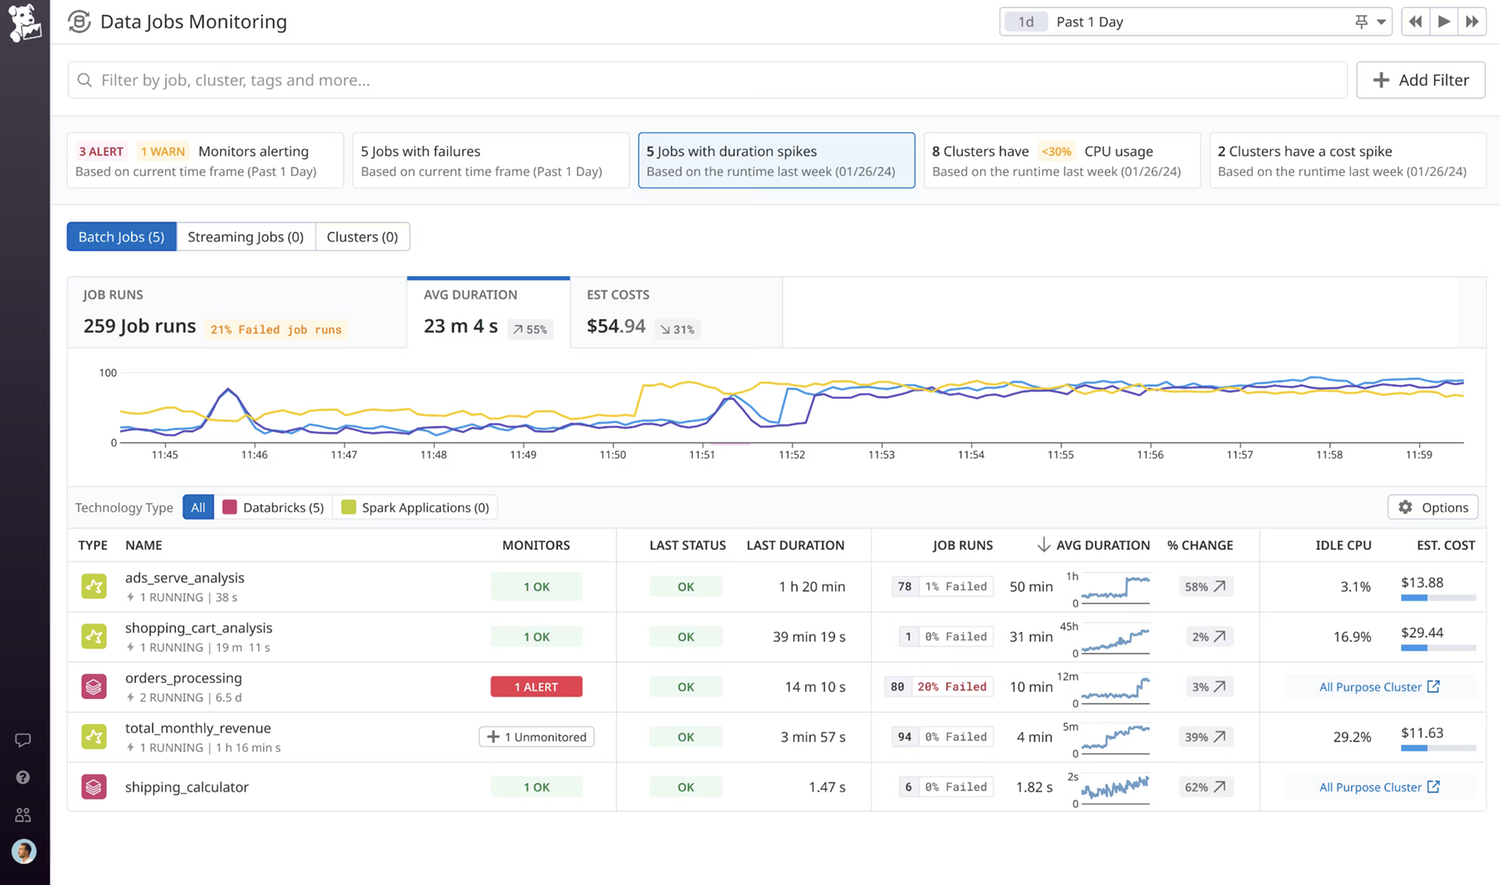
Detect problematic jobs
Detect job failures and latency spikes anywhere in your data pipelines.
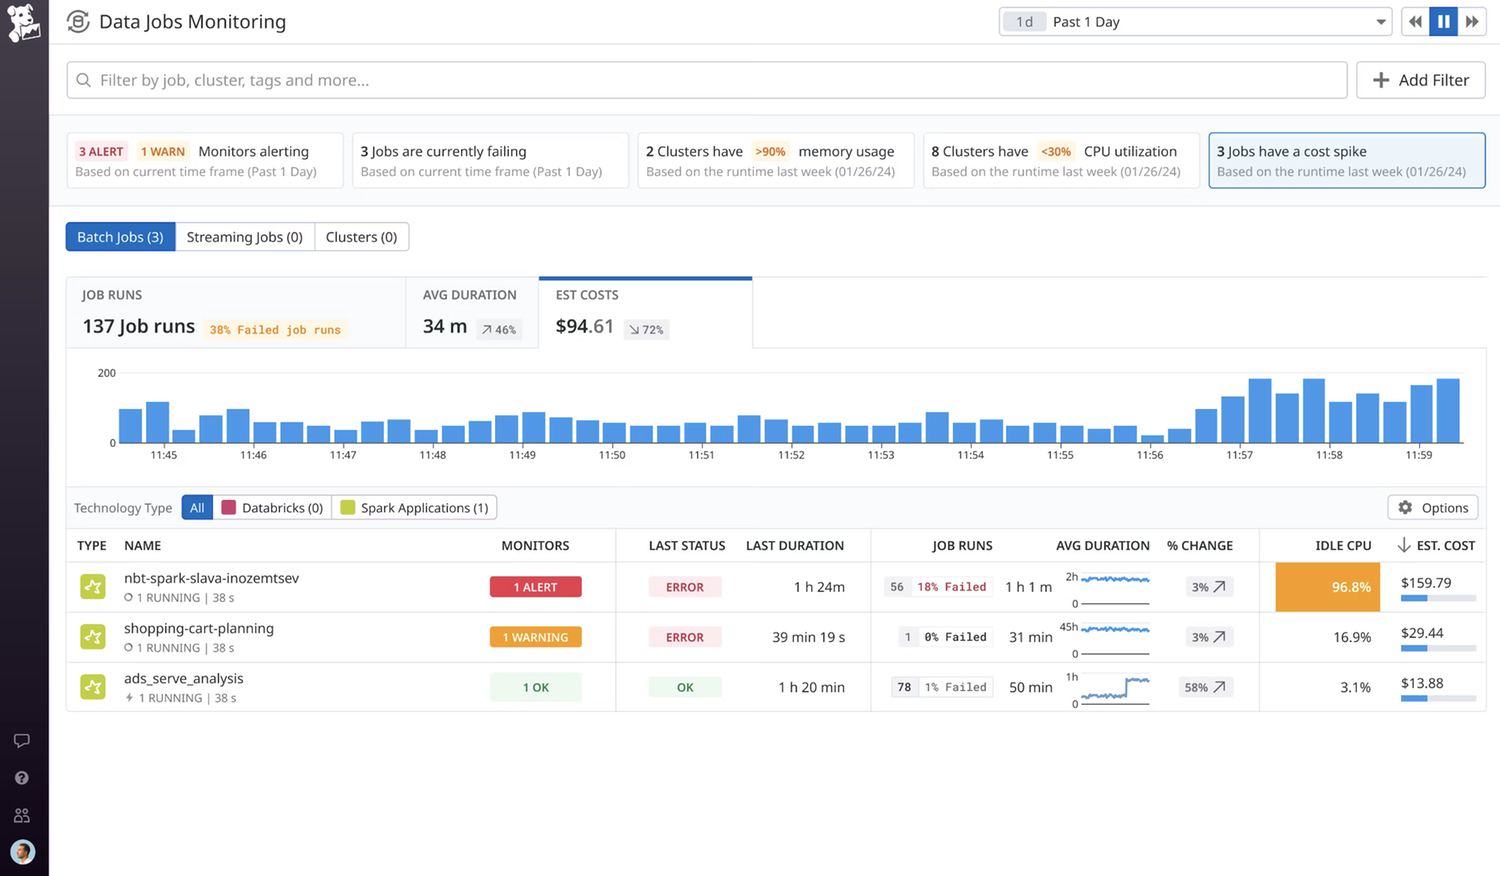
Prioritize job issue resolution more efficiently by using recommended filters to surface the important issues impacting job and cluster health, such as failures, latency, cost spikes, and more.
Visualize trends and anomalies in job performance to quickly analyze your data platform’s reliability and estimated costs.
Notify teams immediately when their jobs have failed or are still running beyond the expected completion time using out-of-the-box alerts.
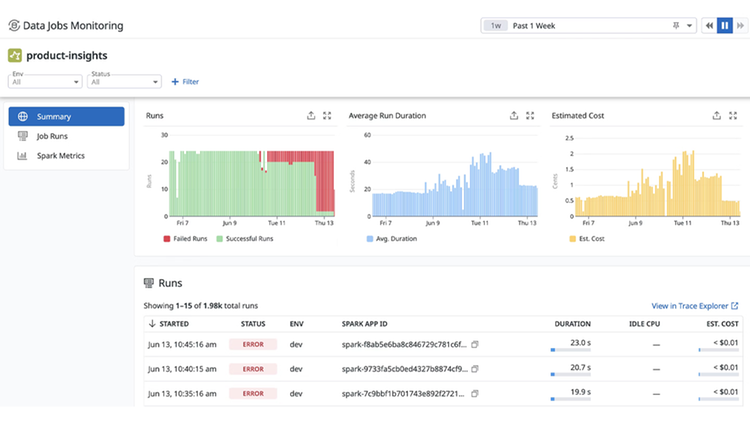
Resolve failures & latency
Pinpoint and resolve failed and long-running jobs faster.
Compare recent runs of a job to expedite root cause analysis, surfacing trends and changes in run duration, Spark performance metrics, cluster utilization, and configuration.
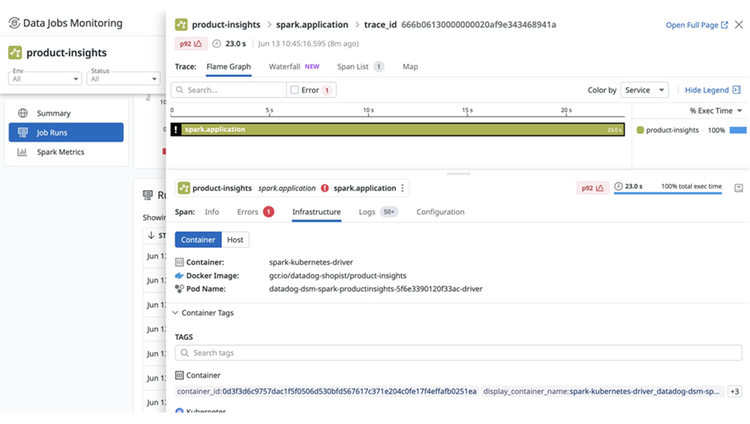
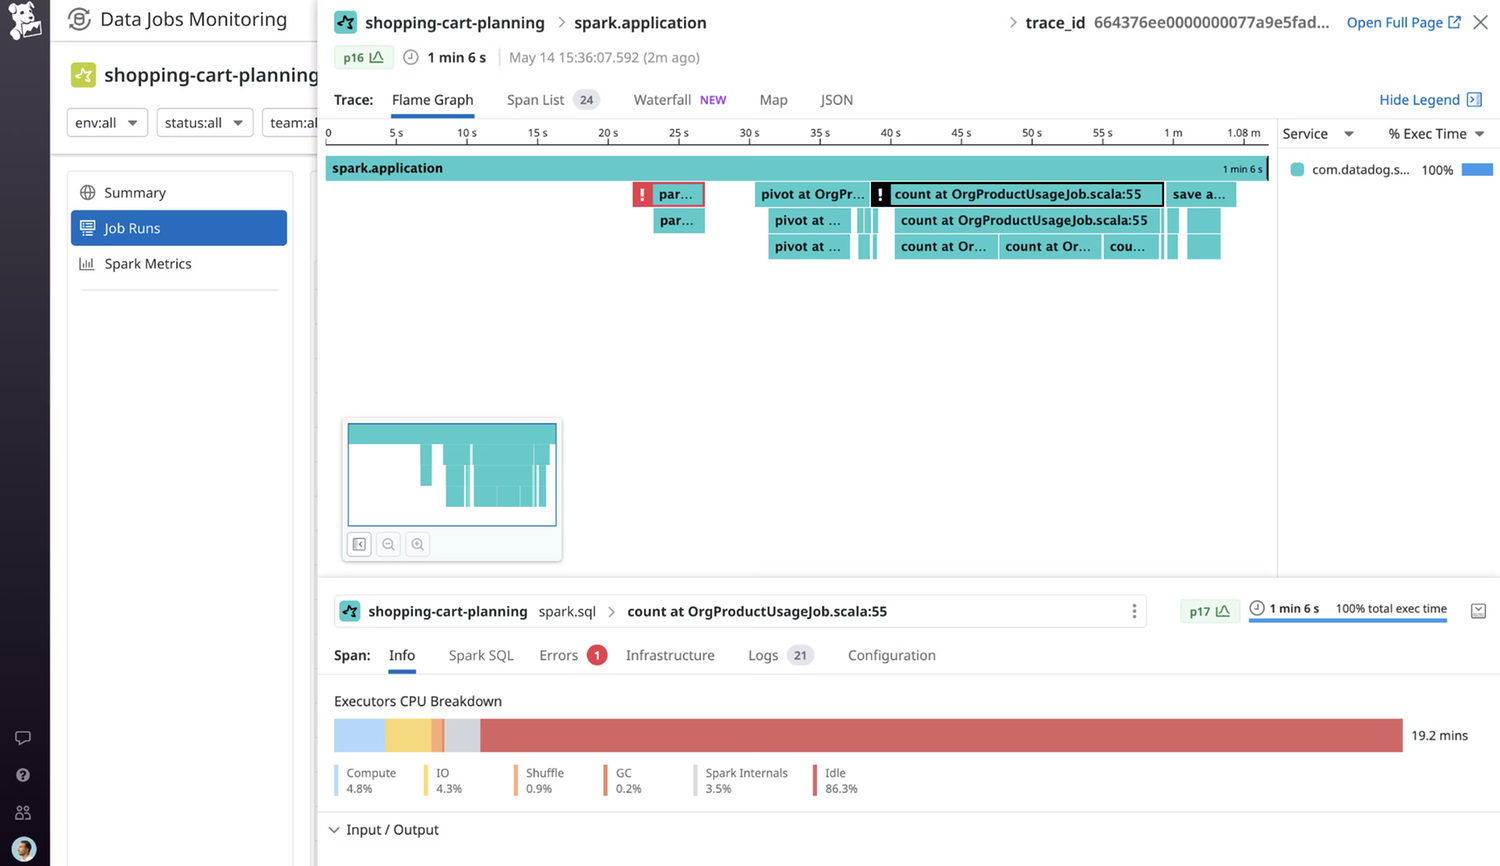
Uncover root cause of slow jobs by identifying inefficient Spark stages or SQL queries that could be impacted by data skew, disk spill, or other common factors.
Drill down into a detailed trace view of a job to see the full execution flow (i.e., job, stages, and tasks) and where it failed for full troubleshooting context.
Cost-optimize clusters & jobs
Reduce costs by optimizing misallocated clusters and inefficient jobs.
Surface the largest savings opportunities by viewing the idle compute for the largest jobs and cluster utilization over time, segmented by different data teams or environments to see which is incorrectly provisioned.
Increase job run efficiency at the application level by using Spark execution metrics to determine improvements in the code or configuration.
Lower compute costs by identifying overprovisioned clusters and changing the number of worker nodes and instance types.
Centralize data pipeline visibility
Centralize data pipeline visibility with the rest of your cloud infrastructure.
Accelerate incident response and debugging with flexible tagging that route alerts for data pipeline issues to the right teams.
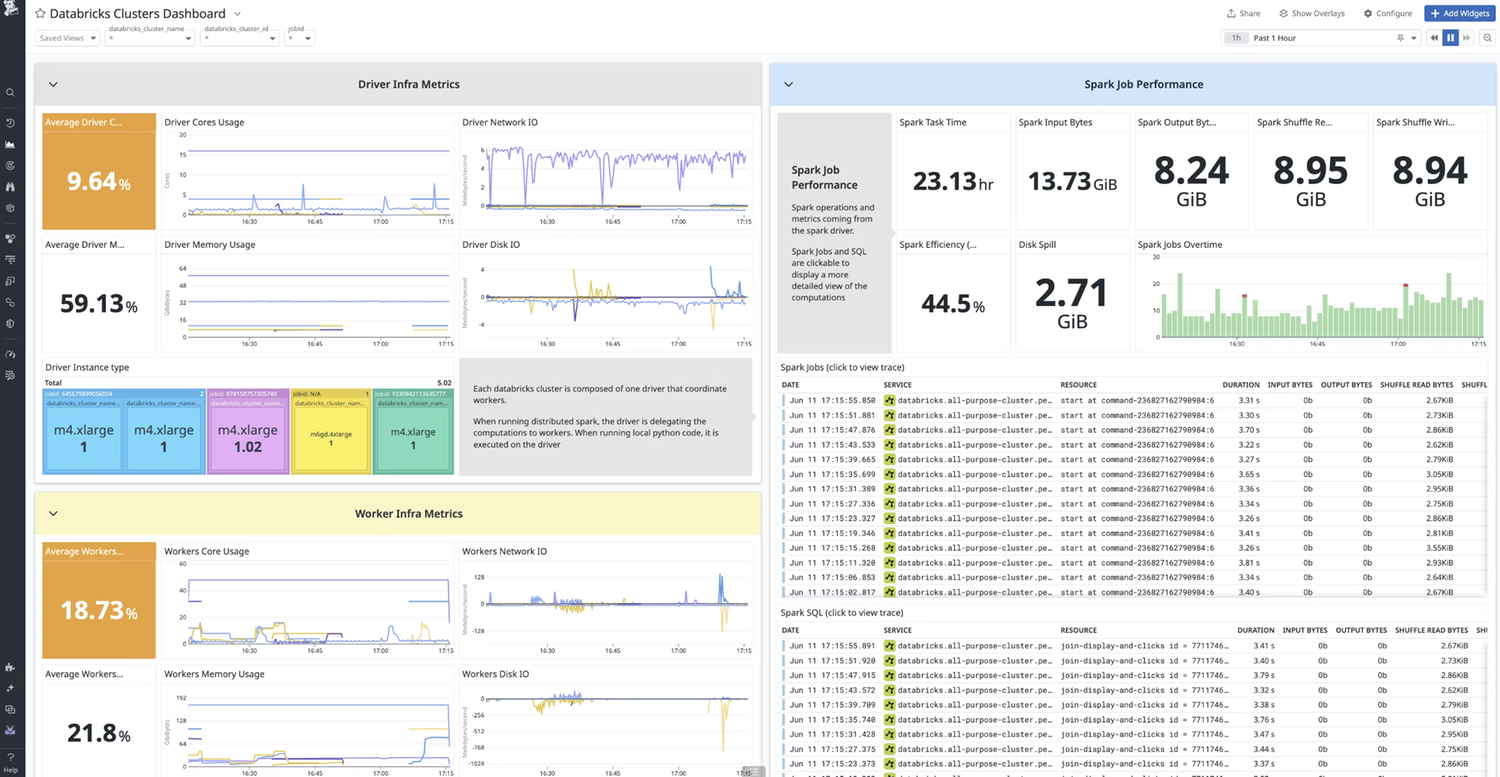
Pivot seamlessly between key data pipeline metrics to understand what influenced job failures or latency spikes, such as infrastructure metrics, Spark metrics, logs, configuration.
Gain complete data pipeline visibility in a unified dashboard, viewing data storage, warehouse, and orchestrator metrics from other key technologies such as Snowflake and Airflow in the same place as your job telemetry.
Unified Platform
Unified platform for faster troubleshooting.
Generate metrics from logs, processes, or application traces for system-wide visualization and alerting.
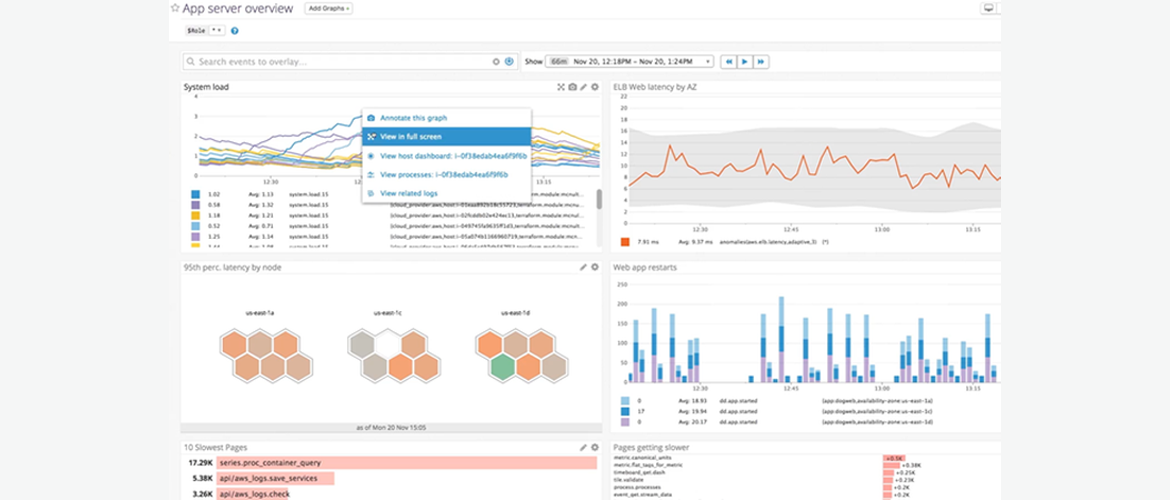
Troubleshoot more quickly with one-click correlation of related metrics, traces, and logs from across the stack.
Unify development, security, network, and operations in a single platform to cut down finger-pointing and miscommunication.
Advanced Capabilities
Advanced collection capabilities.
Access globally accurate percentiles with Distribution metrics, like p99 latency across a distributed service.
Incorporate business-level custom metrics like revenue or customer behavior with DogStatsD or via the API.
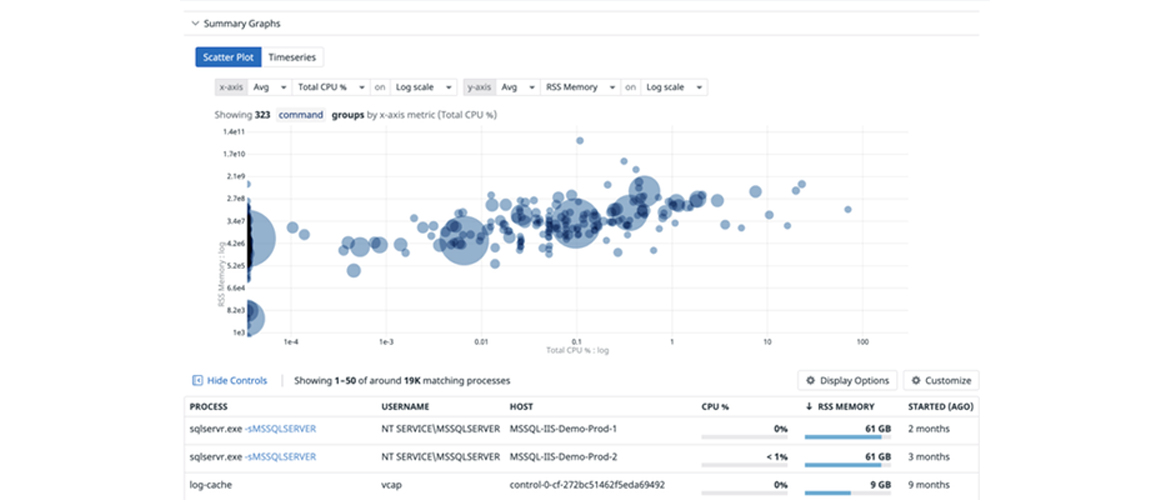
Track the impact of every process running in the stack with live process monitoring.
Additional Information
Terms & Conditions
Terms of Service
https://www.datadoghq.com/legal/terms/Privacy Policy
https://www.datadoghq.com/legal/privacy/Resources
Datadog Jobs Monitoring - Datadog Overview
Datadog offers a single unified platform to monitor your infrastructure, applications, networks, security threats, UX, and more.
Powered by WHMCompleteSolution
