
Datadog Network Monitoring
by Device and performance monitoring

Get full visibility across your on-prem network equipment
$7.20/month
Datadog Network Performance Monitoring provides full visibility into every network component that makes up your on-prem, cloud, and hybrid environments, with little to no overhead. By monitoring the performance of connections among your hosts, services, virtual private clouds (VPCs), and other elements, you can quickly determine when your network is the root cause of any issue. We seamlessly consolidate monitoring and troubleshooting of routers, firewalls, switches, load balancers, and other network devices. With full support for SNMP, Netflow, syslog, and other data formats and sources, we provide full visibility across your on-prem network equipment.
Top Features
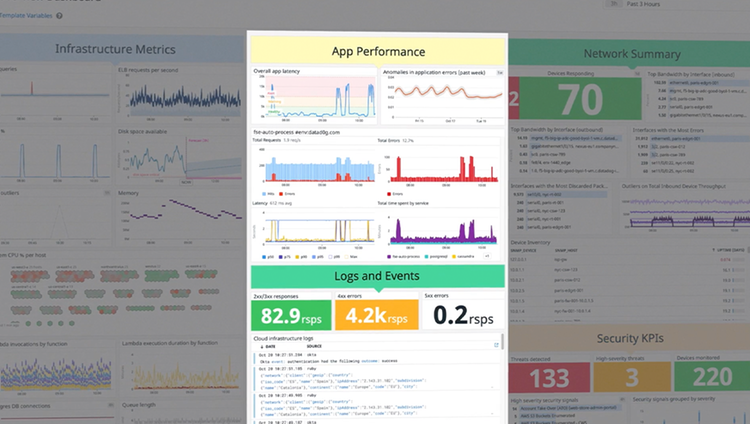
Act on real-time network insights
Gain deep DNS visibility
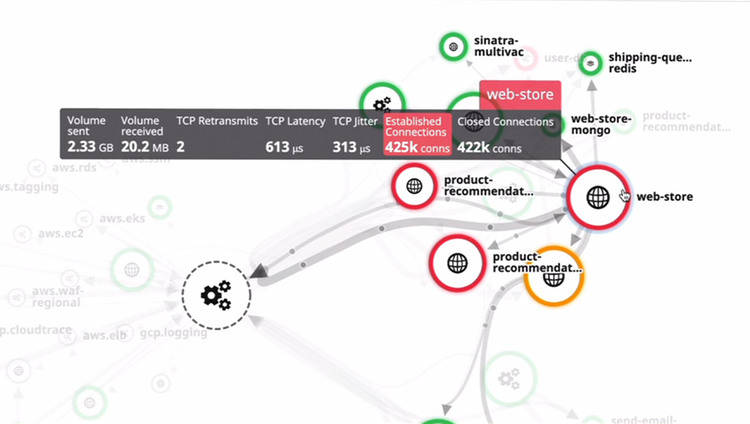
See what matters—not just IP addresses
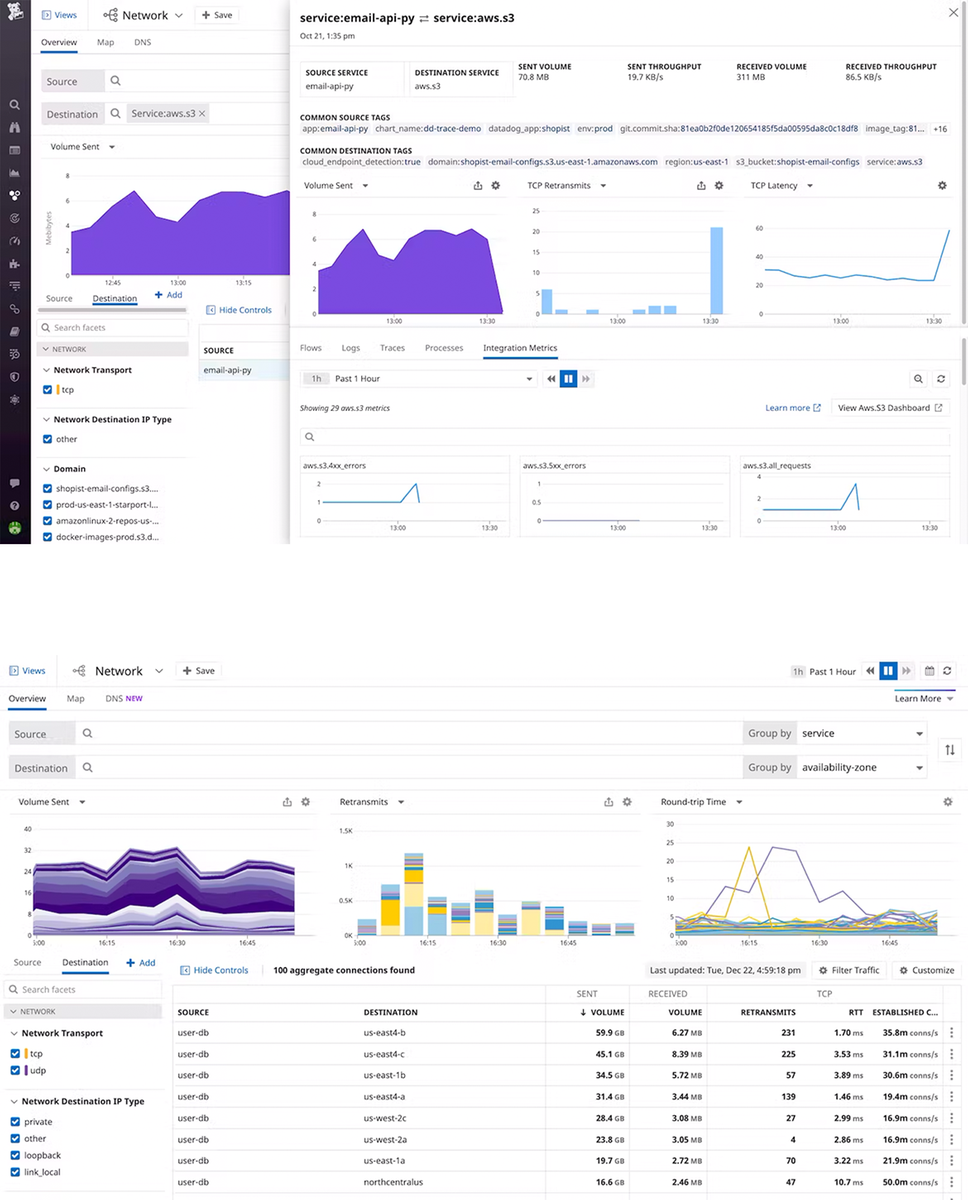
Monitor connections to cloud services
Recommended products


Network Performance Monitoring
End-to-end visibility into on-prem and cloud networks, including application-layer performance and the health of bare-metal appliances.
Act on real-time network insights
Track key network metrics, such as TCP retransmits, latency, and connection churn.
Monitor the health of traffic between any two endpoints at the app, IP address, port, or process ID (PID) layers.
Use visualizations of network traffic across applications, containers, availability zones, and datacenters to help optimize your migrations.
See what matters—not just IP addresses
Isolate network issues in your Envoy-powered service mesh and troubleshoot inefficient load balancing.
View communication between services, pods, cloud regions, and cloud resources.
Manage cloud networking costs by pinpointing the services and teams responsible for large traffic spikes.
Gain deep DNS visibility
Analyze system-wide DNS performance without having to SSH into individual machines.
Assess DNS server health with request-volume, response-time, and error-code metrics.
Distinguish between client-side errors and server-side failures.
Monitor connections to cloud services
Observe and analyze traffic to Amazon S3, Amazon Elastic Load Balancing (ELB),GCP BigQuery, and other managed cloud services.
Filter down into subcomponents such as specific S3 buckets or RDS databases for more granular insights.
Pivot to integration metrics to determine if an issue lies with a cloud provider or originates from your systems.
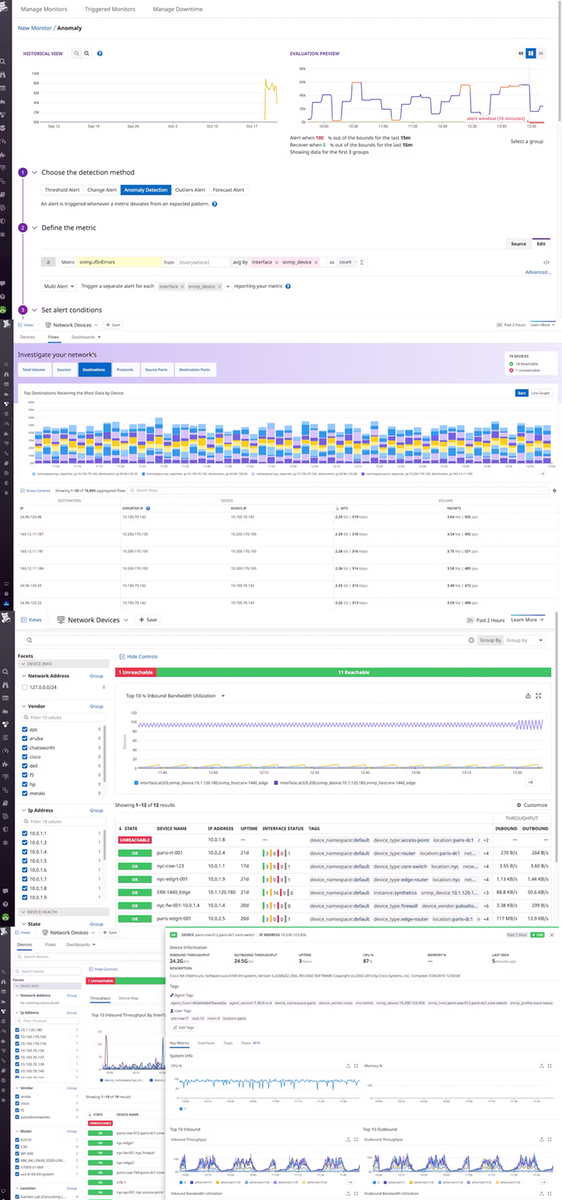
Network Device Monitoring
Unified health monitoring, troubleshooting, and capacity planning for network equipment.
View stats on any interface, on any device, on any network
Automatically discover and collect metrics on your network from any device, including those from Cisco, Palo Alto, Dell, F5, Juniper, and other leading brands.
Monitor even the largest environments with a highly scalable and lightweight agent.
Take inventory with a complete list of all your network hardware.
Quickly expose performance with next-level tooling
Search for devices and then drill down to view the performance of specific interfaces with a single click.
Create custom dashboards with drag-and-drop widgets to help you evaluate device performance at a glance.
Filter device data according to helpful parameters, such as location.
Get full visibility into traffic flows for troubleshooting and capacity planning
Filter network flow data by key information including volume, IP address, protocol, TCP/UDP source/destination port, and other out-of-the-box and custom tags.
Easily surface top talkers and rates of TCP flags such as RST, SYN, ACK, PSF, FIN, and URG.
Collect network flow data in common formats and standards including Netflow, IPFIX, sFlow, and J-Flow.
Identify device-level problems with SNMP Traps
Drill down into individual devices to see its SNMP Trap history.
Speed up troubleshooting with access to full Trap context, including Trap name, OID, namespace, admin status, and more.
Create monitors on specific SNMP Trap events to get alerted to device issues as soon as they occur.
Detect issues faster through advanced alerting
Rely on anomaly detection to quickly spot a malfunctioning device.
Use forecasting to determine when interfaces will exceed their available bandwidth.
Quickly configure alerts on many devices or interfaces at once.
Reduce mean time to resolution (MTTR)
Correlate issues between network and application teams thanks to an all-in-one tool.
Consolidate all your network monitoring needs into a single pane of glass.
Collaborate across teams, move faster, and solve problems more efficiently.
Troubleshoot network problems and create alerts using syslog messages
Retain device logs for root cause analysis and compliance.
See syslog messages in the context of other events for improved troubleshooting.
Set syslog-based monitors on specific SNMP trap names or other elements of the syslog record.
Additional Information
Terms & Conditions
Terms of Service
https://www.datadoghq.com/legal/terms/Privacy Policy
https://www.datadoghq.com/legal/privacy/Resources
Datadog Network Monitoring - Device (NDM)
Datadog Network Device Monitoring (NDM) provides deep visibility into your full inventory of network-connected devices. Datadog autodiscovers devices from any network.
Datadog Network Monitoring - Performance (NPM)
Datadog Network Performance Monitoring (NPM) provides end-to-end visibility into on-prem, cloud, and hybrid networks.
Powered by WHMCompleteSolution
