
SolarWinds® AppOptics
by APM and infrastructure tool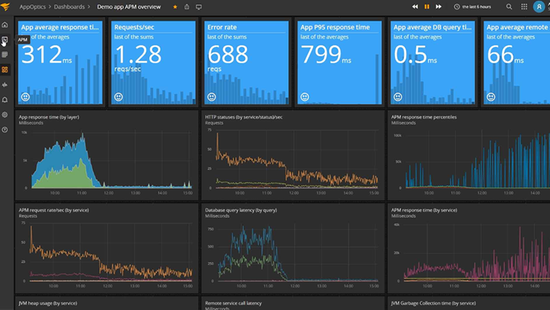

Affordable SaaS-based APM for robust infrastructure & application
$1,199.00/year
Your business relies on applications & their downtime can lead to reduced productivity, unhappy customers & potential revenue loss. To ensure seamless operations, you need to monitor the performance of your applications & infrastructure, regardless of their location. This proactive approach detects potential issues early & addresses them before they affect your users. SolarWinds® AppOptics is a cloud-based application performance monitoring (APM) & infrastructure monitoring platform designed to assist organizations in optimizing the performance of their applications & infrastructure in cloud-native & hybrid environments. It's part of the SolarWinds suite, providing comprehensive IT management & monitoring solutions.
Top Features
Unprecedented visibility
Complete visibility into the health and performance of your applications and their supporting infrastructure.
Performing as designed
Create performance metrics to automate the monitoring of business-critical services and applications.
Quick problem identification, fast resolution
Minimize downtime with early warning notifications. If systems fail, help ensure you can recover quickly.
Cost-effectively scale with your business
Support the ebbs and flows of your business. Use a cloud-scale APM tool designed for today’s dynamic IT environment.
Recommended products


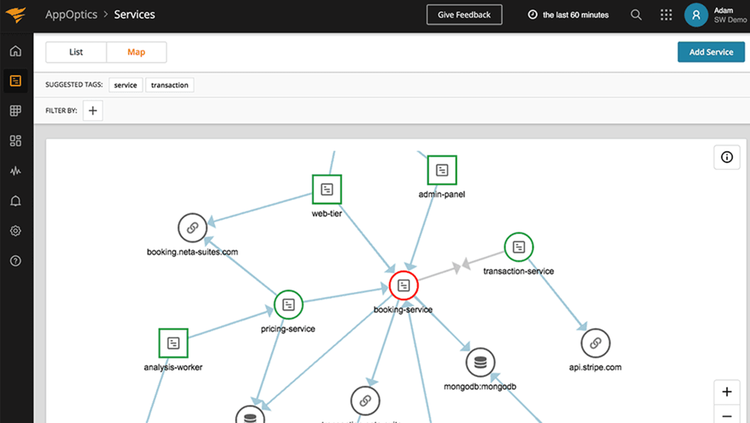
Auto-instrumented Application Service Topology Map
Provide users with a view showing the relationships between services and their dependencies.
The service map is meant to provide context for how a service or dependency translates to end-user performance. With the application service map, you can move into a particular service to view more detailed performance metrics (root cause of service degradation, transaction traces, exceptions, performance over time, etc.).
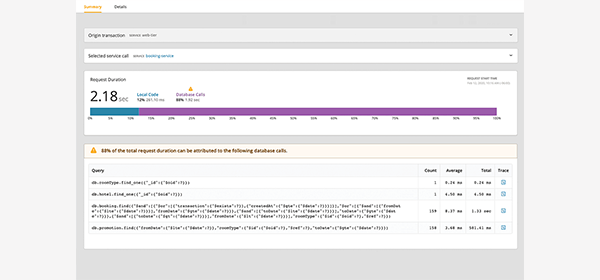
Pinpoint the Root Cause of Performance Issues
Find slow queries, bugs, inefficient code, or problems with the infrastructure.
AppOptics trace- and service-level root causes simplify pinpointing application performance issues. These simplified views work for legacy monolithic applications just as well as they work for modern apps running in Kubernetes. Remove the guesswork from your incident response and have your teams focus on working together to solve the problem.
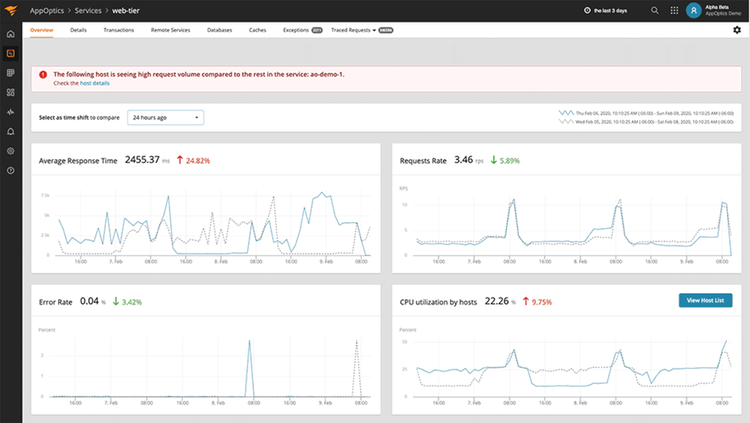
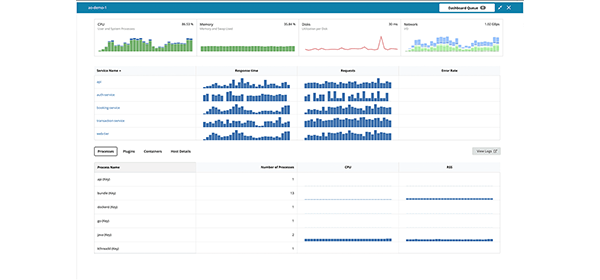
Performance Monitoring
Comprehensive performance monitoring, from custom on-premises to your highly distributed cloud applications, in one product.
AppOptics performance monitoring goes deep and wide, including applications, transactions, services, servers, hosts, containers, and serverless. It’s powerful made simple with auto-instrumentation, a one-click connection from hosts and transactions to their associated logs, and simplified root cause summaries, making APM valuable in just about anyone’s hands.
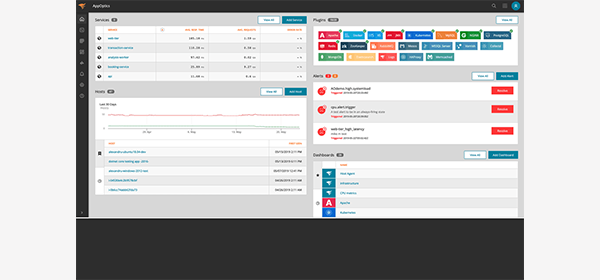
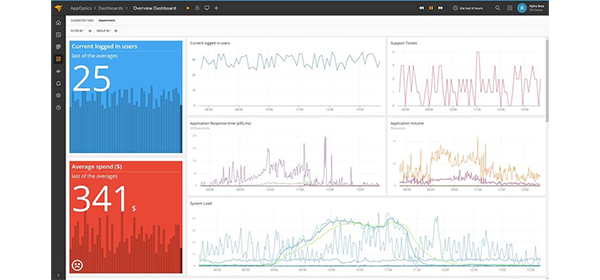
Full-stack Visibility
Remove the wall between Application and Infrastructure metrics, allowing combined dashboards.
Get a bird's-eye view across all your servers, hosts, containers, and serverless environments. Cross-reference application and infrastructure metrics side by side in the same dashboard.
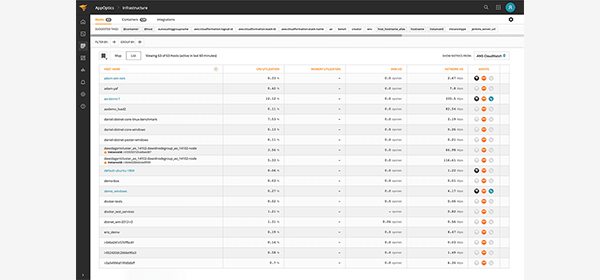
Modern Infrastructure Monitoring
Consolidated monitoring of all your servers, hosts, containers, and serverless environments.
Infrastructure monitoring for your legacy and new IT implementations with simple-to-click drill-downs into resource utilization and performance by services, containers, and processes.
AWS Monitoring
SaaS-based monitoring of your AWS services and custom applications.
Monitor over 30 AWS services with broad application language support (.Net, Java, PHP, Python, Scala, Node.js, Go, and Ruby).
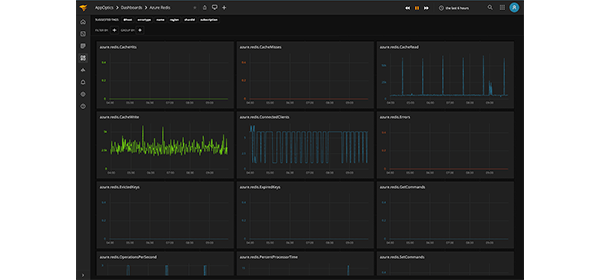
Azure Monitoring
SaaS-based monitoring of your Azure services and custom applications.
Monitor Azure services including Load Balancer, Cosmos DB, SQL Database, Redis, and Azure App Services with broad application language support (Java, PHP, Python, Scala, Node.js, Go, and Ruby).
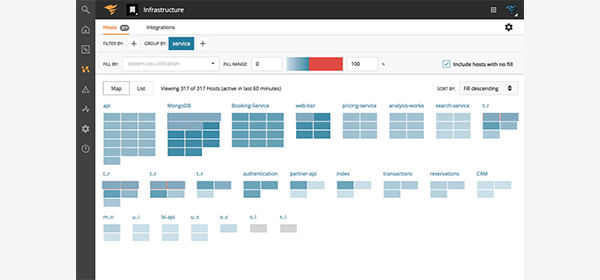
Identify Hotspots Early
Quickly identify which hosts have exceeded thresholds and could be impacting application availability and performance.
Avoid downtime with color-coded heatmaps that provide visualizations of all your hosts, and containers with comprehensive alerting on key performance metrics across the stack.
150+ Plugins and Integrations
With over 150 out-of-the-box plugins, integrations, and custom metrics, you have everything you need to monitor your critical systems.
Measure what matters with AppOptics. It's an APM tool offering the ability to perform full-stack monitoring of your systems, including key business metrics associated with those applications.
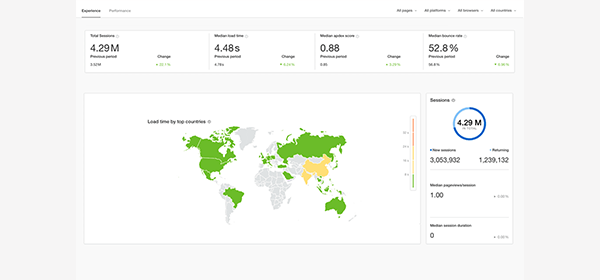
Digital Experience Monitoring
Make your websites more reliable with client-side performance monitoring integrated with your APM.
Achieve complete observability and accelerate troubleshooting by integrating synthetic monitoring and real-user monitoring powered by SolarWinds® Pingdom®.
Additional Information
Terms & Conditions
Terms of Service
https://www.solarwinds.com/legal/termsPrivacy Policy
https://www.solarwinds.com/legal/privacyResources
SolarWinds® AppOptics - Onboarding - Infrastructure Monitoring
This quick guided tour will leave you expertly navigating your host & container maps and digging into your system's metrics.
SolarWinds® AppOptics - Seamless Application and Infrastructure Monitoring
SolarWinds® AppOptics™ is a powerful, SaaS-based infrastructure and application monitoring solution for custom on-premises, cloud, and hybrid systems.
SolarWinds® AppOptics - How to Get Started
This how-to video will help you get the most out of your application performance monitoring by covering basics such as how to examine database queries, isolate individual trace requests, and more.
Powered by WHMCompleteSolution
