
Datadog Modern Application Performance Monitoring
by Monitor & optimize app performance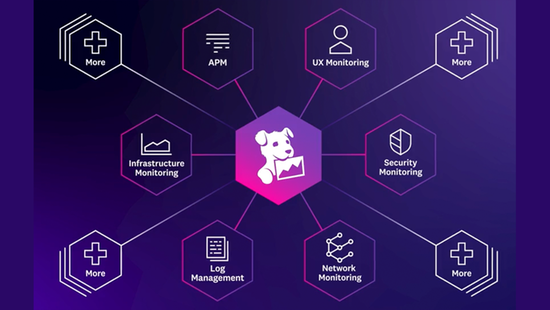

End-to-end network tracing and service-centric reliability at scale
$372.00/month
Datadog Application Performance Monitoring (APM) provides end-to-end distributed tracing from frontend devices to databases—with no sampling. By seamlessly correlating distributed traces with frontend and backend data, Datadog APM enables you to monitor service dependencies, reduce latency, and eliminate errors so that your users get the best possible experience.
Top Features
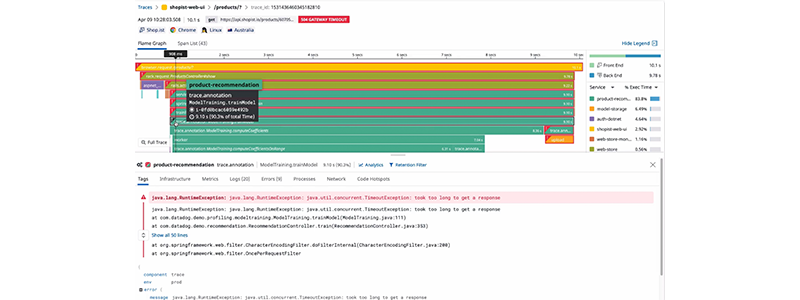
Code-Level Visibility
Code-level visibility, instant root cause analysis.
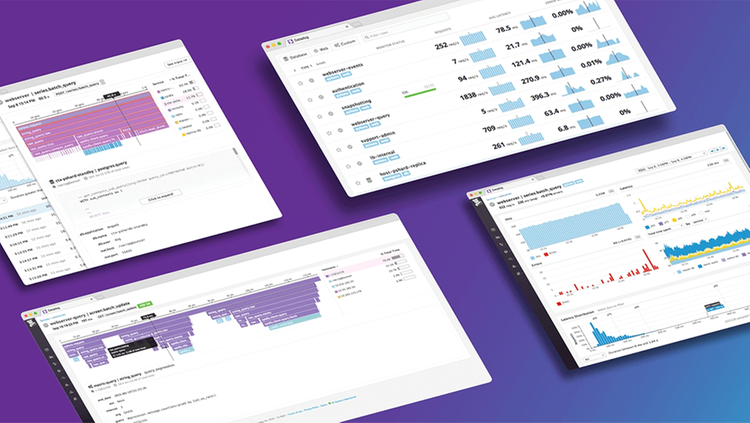
End-to-End Tracing
End-to-end application performance monitoring.
Auto-Instrumentation
Monitor application performance of any stack, anywhere.
Live visibility, complete control
Tracing without Limits: no sampling, no blind spots.
Deployment Tracking
Track deploys, ship with confidence.
Live visibility, complete control
Tracing without Limits: no sampling, no blind spots.
Deployment Tracking
Track deploys, ship with confidence.
End-to-End Tracing
End-to-end application performance monitoring.
Code-Level Visibility
Code-level visibility, instant root cause analysis.
Auto-Instrumentation
Monitor application performance of any stack, anywhere.
Recommended products


End-to-End Tracing
End-to-end application performance monitoring.
Follow requests from RUM sessions to services, serverless functions, and databases
View traces and logs in context with automatic trace_id injection
Connect distributed traces to infrastructure metrics, network calls, and live processes
Tie synthetic API and browser test failures to backend errors
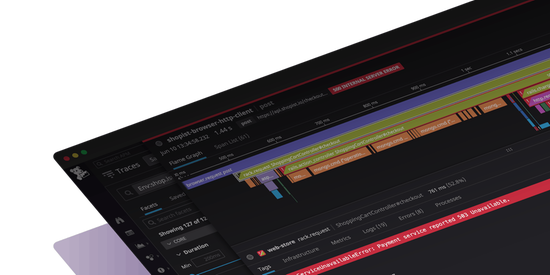
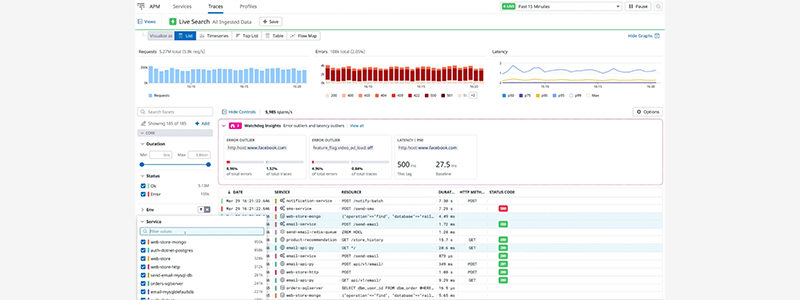
Live visibility, complete control
Tracing without Limits: no sampling, no blind spots.
Investigate incidents faster with real-time visibility into all ingested traces and service dependencies over the last 15 minutes
Resolve issues quicker with ML-based insights that automatically surface error and latency outliers during active investigations
Retain only the traces that are most important to your business by setting custom tag-based retention filters
Set SLOs, track trends, and monitor KPIs by generating span-based metrics using any set of tags
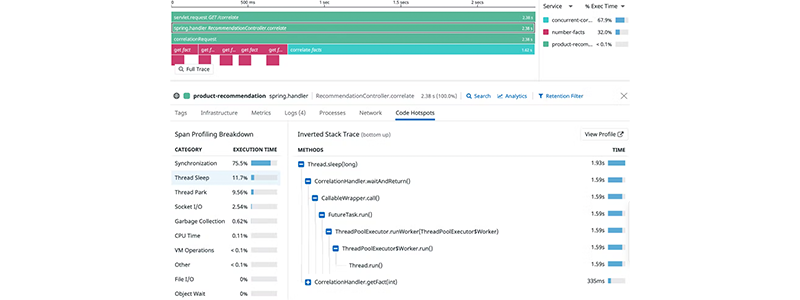
Code-Level Visibility
Code-level visibility, instant root cause analysis.
Optimize your production code and save on compute costs with always-on, low overhead code profiling
Reduce service latency with a breakdown of slow requests by time spent in code on CPU, GC, lock contention, and I/O
Explain performance regressions caused by inefficient code by comparing code profiles using any tag and timeframe
Improve application performance by monitoring profile aggregations of services and endpoints and detecting bottlenecks in your code
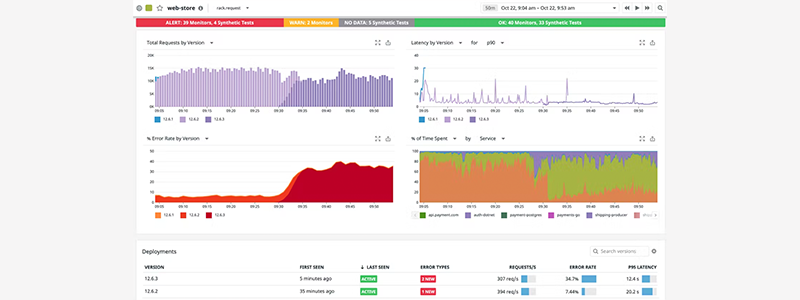
Deployment Tracking
Track deploys, ship with confidence.
Monitor and compare impacts of canary, blue-green, and shadow deploys on application performance
Pinpoint error and latency outliers with out-of-the-box service dashboards
Visualize service dependency changes due to deploys using the Service Map
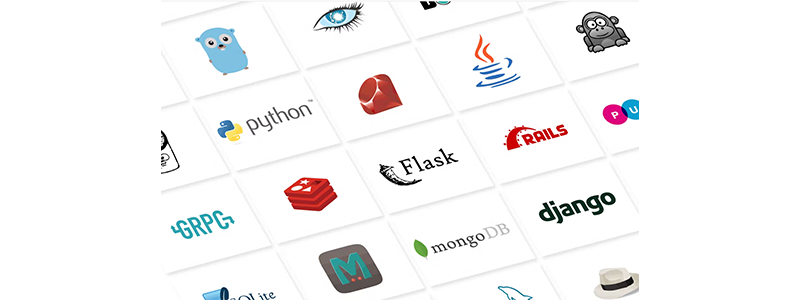
Auto-Instrumentation
Monitor application performance of any stack, anywhere.
Deploy application performance monitoring in seconds on hosts, containers, serverless functions, and PaaS, and auto-instrument your application effortlessly
Utilize hundreds of integrations with third-party frameworks or libraries for unparalleled visibility into Java, .NET, PHP, Node.js, Ruby, Python, Go, or C++ applications
Access flexible support for vendor-neutral standards such as OpenTelemetry and OpenTracing
Additional Information
Terms & Conditions
Terms of Service
https://www.datadoghq.com/legal/terms/Privacy Policy
https://www.datadoghq.com/legal/privacy/Resources
Datadog Modern Application Performance Monitoring - Case Study - Nextdoor
Nextdoor: Simplifying root cause analysis with APM and App Analytics
Datadog Modern Application Performance Monitoring - Case Study - Orderbird
How Datadog’s unified platform helps Orderbird respond faster to outages
Datadog Modern Application Performance Monitoring - Case Study - Braze
Delivering reliability at scale with APM and performance SLOs
