
SolarWinds® SQL Sentry
by SQL server performance monitoring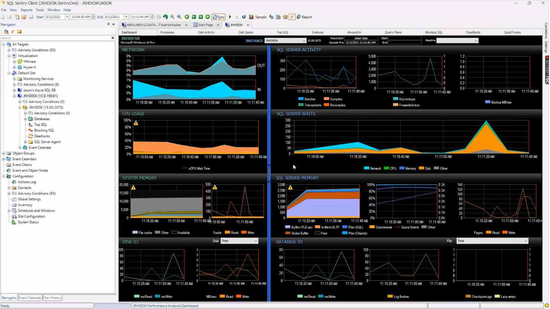

Gain visibility across your Microsoft database environment
$91.00/year
SolarWinds® SQL Sentry is a powerful database performance monitoring solution designed to help you find and fix database performance problems—and prevent future challenges—that could delay data delivery or even bring business data systems to a halt. SQL Sentry collects and retains historical data, allowing for real-time troubleshooting and investigating long-term patterns & changes. It enables users to correlate events and perform root cause analysis of performance issues and job failures. The intelligent alerting feature is customizable, allowing users to create their own Advisory Conditions and Response Rulesets, ensuring you receive only important and unexpected alerts.
Top Features
Visibility across your SQL Server and Azure SQL database environment
Visibility across your SQL Server and Azure SQL database environment Monitor SQL Server, Azure® SQL Database, SQL Server Analysis Services (SSAS), and Windows® & VMware® hosts.
SQL Sentry portal
View detailed, actionable information on the performance of your monitored SQL Server, Azure SQL Database, and Windows targets from the installed SQL Sentry web interface.
Actionable performance information
View real-time and historical performance metrics in an intuitive dashboard and easily drill down into details to uncover the root cause of performance problems.
High-impact query analysis with Top SQL
See long-running and high-impact queries in the Top SQL view, which helps you easily identify and fix query performance bottlenecks.
Proactive alerting and response system
With customizable advisory conditions, you can set relevant, actionable alerts and automate responses to specific conditions to prevent alert fatigue.
Scalable monitoring
SQL Sentry has proven scalability, with demonstrated success monitoring 800+ SQL server instances with one monitoring database.
Comprehensive query optimization with Plan Explorer
Analyze query stats, plan recosting, and indexes and view query plan diagrams with built-in Plan Explorer.
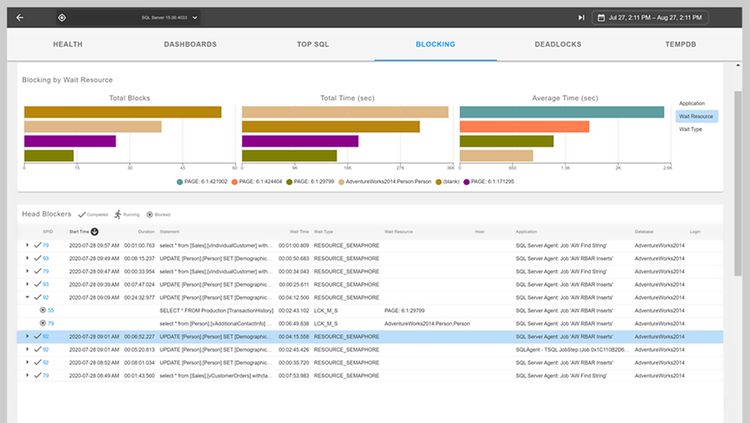
Blocking analysis
Analyze blocking details to quickly identify the root cause—and understand the full impact—of a block.
Event calendar
Manage SQL Server and Windows events with an Outlook-style calendar you can customize to track the events that matter most to you.
Deadlock analysis
Quickly determine the root cause of deadlocks, so you can restore your database to optimal performance.
Storage forecasting
Use Storage Forecasting, which applies machine learning to forecast daily storage usage, to proactively manage compute resources.
Support for multiple SQL Server implementations
Monitor SQL Server running in any environment, including SQL Server on Linux, Amazon RDS, Amazon EC2, and Azure SQL Database Managed Instance.
Recommended products


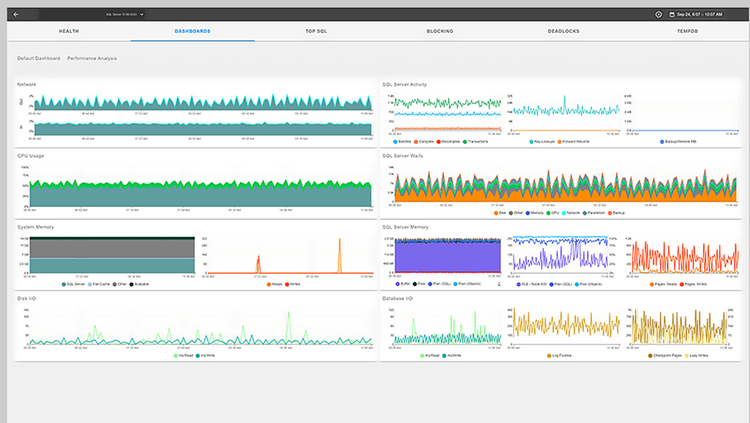
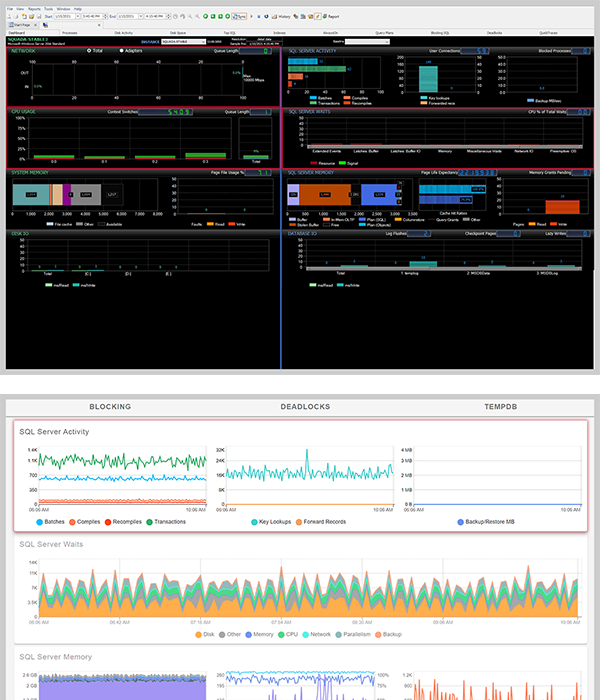
Performance Analysis Dashboard
An at-a-glance view of important database environment performance metrics.
Monitor all aspects of your environment from a single dashboard display
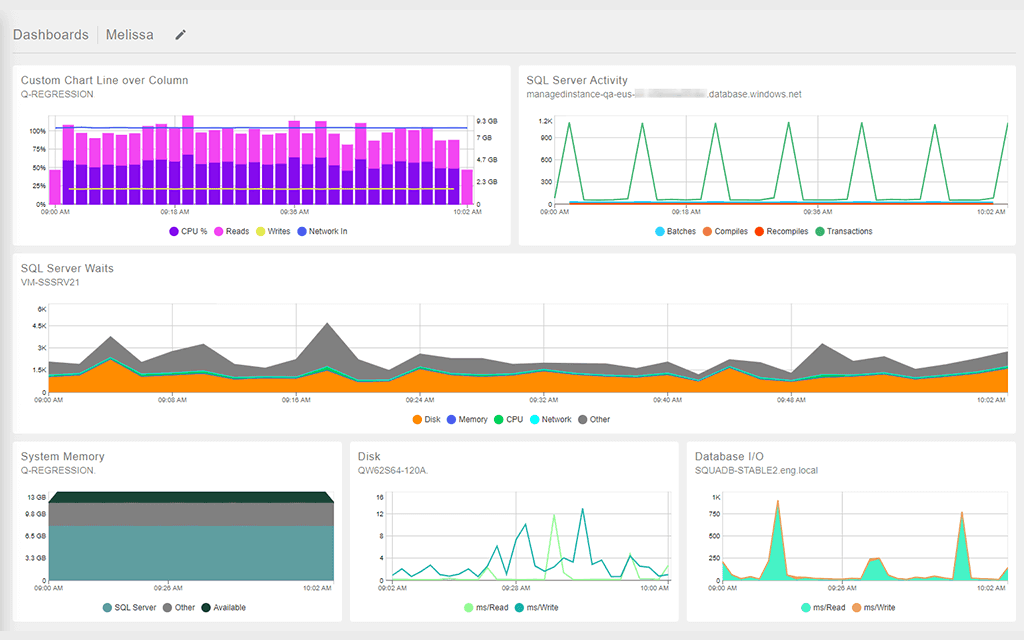
With the SQL Sentry® Performance Analysis Dashboard, you can display important database performance metrics used in determining the load and health of a monitored SQL Server instance.
Sample and History modes
You have two dashboard modes: Sample mode and History mode. In Sample mode, you can see activity for a specific time, and in History mode, you can display how Windows and the SQL Server instance have been performing over a selected time period. In History mode, you can also overlay your display with a baseline showing your server's current performance data relative to the chosen benchmark baselines. In this view, you might even see warning indicators for various SQL Sentry Advisory Conditions.
System Memory
The System Memory section displays information about the amount of memory being used by different processes on the server as well as page faults and page file usage. The Disk I/O section displays the read and writes latencies for each of the physical disks on the server.
SQL Server Activity
The SQL Server Activity section displays information about what the server instance is doing, including blocked processes, average transactions per second, and more. The Wait section presents information about the classes and categories of waits that have occurred as well as the duration in milliseconds these waits were in effect during the time period.
Database Memory
The Database Memory section provides information about how the server instance is utilizing the memory allocated to it. This includes buffer cache size, plan cache size, and more. The Database I/O section provides information about the read and write latency of your databases, lazy writes, and more.
Advisory Conditions
Intelligent alerts can warn you about database performance problems.
Advanced alerting and response capabilities for your SQL Server environment
SQL Sentry Advisory Conditions form an advanced alerting and response system that allows you to customize SQL Sentry to respond to any Windows, virtual machine (VM), or SQL Server database condition with complex logic based on performance counter thresholds, query results, and more.
Pre-built Advisory Conditions
SQL Sentry includes pre-built Advisory Conditions, which you can configure for your environment. Conditions can be set up at different levels of inheritance within your monitored environment. You can view the list of Advisory Conditions available to you, create a new condition, edit an existing condition, and view the condition events log, which gives you information when the condition was last evaluated for “True” and more.
Plan Explorer – SQL Query Analysis
Quickly get to the root of query problems with a free query analysis tool.
Index analysis
The SQL Sentry® Plan Explorer® free query analyzer includes scoring algorithms to help you determine the best index to support a given query.
You can easily view recommended indexes, create and modify indexes, and detect and update old statistics. Watch the score change in real time as you work toward the elusive 100% score before executing a single line of code against SQL Server.
Statistics analysis with histogram
Clearly see the impact of compiled and runtime query parameters on performance, quickly spot data skew capable of contributing to parameter sniffing issues, visualize the index Tipping Point, and identify opportunities for better indexes.
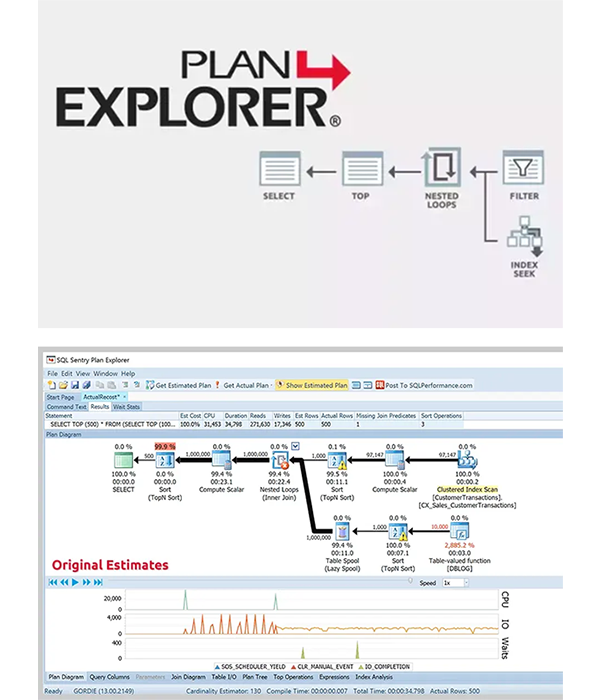
Plan diagram
Quickly identify the most costly operators through intuitive color-coding and various display options, including the ability to view operator costs by I/O or CPU.
Query performance profiling and playback
Replay queries with access to their live performance statistics through integrated history charts.
With the Plan Explorer free query analyzer, you can play back the query profile to see exactly which operators are adding the most load on system resources without having to run the query again.
Actual plan recosting
Instead of delivering only an estimated (and often inaccurate) cost for a plan operator, Plan Explorer can display the actual observed costs. You can see the difference by toggling the view between Estimated and Actual cost.
Storage Forecasting
Prevent business interruptions with Storage Forecasting powered by predictive analytics.
SQL Sentry Storage Forecasting helps remove capacity-planning guesswork
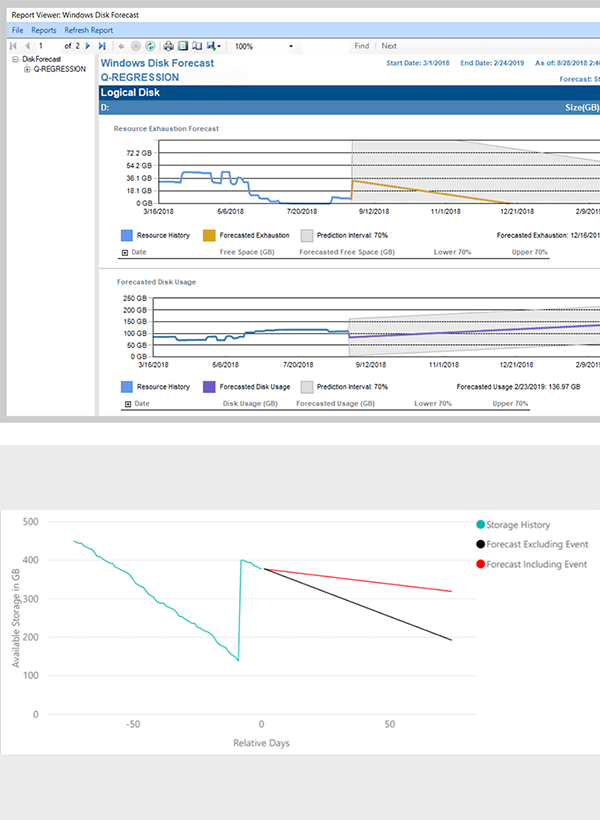
SQL Sentry Storage Forecasting applies machine learning algorithms to forecast daily usage for storage volumes across servers, enabling data professionals to proactively manage compute resources. The algorithms analyze workloads, fine-tune disk capacity forecasts, and provide intelligent reporting to help prevent system downtime.
Daily usage forecasts
Storage Forecasting produces daily usage forecasts for all logical disks, customizes a forecast for each volume, and analyzes previous forecasts daily. Over time, the system learns the unique workload of each volume and fine-tunes its forecasts accordingly.
Windows Disk Forecast report
By default, the Windows Disk Forecast report shows all volumes in the monitored environment that are forecast to run out of space within 180 days. You can customize the report to generate forecasts for up to three years into the future. You can generate a report for all volumes on a particular server, and you can include a capacity planning forecast, so you can take measures to help ensure you’ll meet your future storage needs.
Disk Space tab
By clicking on a logical disk in the Disk Space tab, you’ll see a new chart with a history of available free disk space for the volume for the past 180 days. If a forecast is available, you’ll also get the next forecasted 180 days of consumption.
Alerting for forecasted disk exhaustion
Beyond viewing daily reports of forecasted storage capacity, you can customize Advisory Conditions to receive alerts if any volumes are forecast to run out of space in the next 90 days, or if a forecasted exhaustion date changes by more than a month earlier than previously predicted. Knowing when the forecasted exhaustion date changes help you identify new database deployments or workload changes that could signal accelerated database growth.
SQL Server Event Calendar
Manage SQL Server and Windows events in a visual calendar.
Struggling to efficiently manage SQL Server and Windows jobs and tasks?
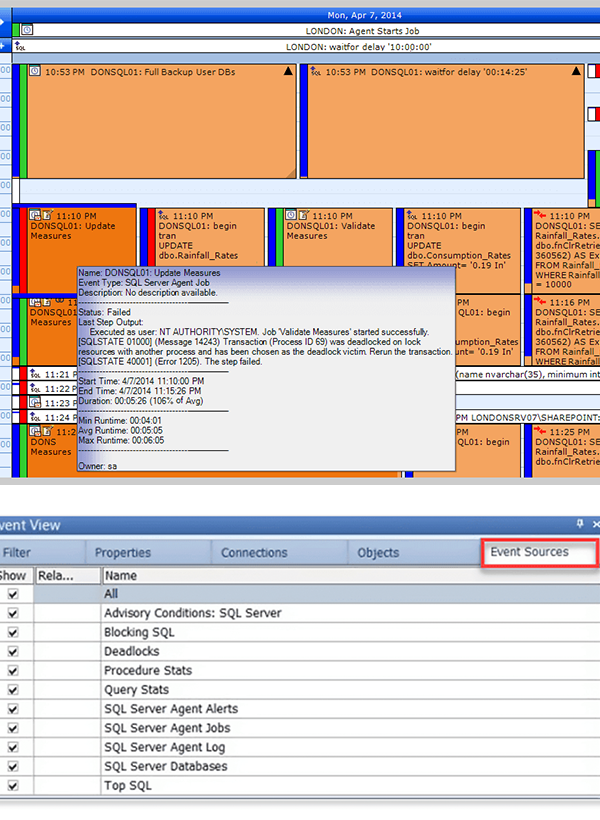
SQL Sentry® Event Calendar gives you the details you need in a visual format so you can easily identify and address potential event conflicts.
View and manage your database environment events in a single calendar
Event Calendar is a centralized event log management capability designed to visually display events across monitored SQL Server instances and help you automate workflows to proactively improve performance.
Filter events
Event Calendar offers powerful filtering capabilities. You can filter calendar events to see, for example, only events associated with SQL Server deadlocks. You can also set which event sources and types appear on the calendar.
Track job runtime
With Event Calendar, you can track the runtime for monitored SQL Server agent jobs. You can compare runtimes for different server instances—for example, when a job will run after a cluster failover.
You can also set up Event Chains, which consist of the series of SQL Server Agent jobs or Windows-scheduled tasks running on the same server or different servers. With Event Chains, you can automate a series of events needing to follow a specific sequence.
Set proactive notifications
You can use Advisory Conditions with the Event Calendar to set automated notifications for your monitored tasks and jobs so you know when database server runtime thresholds have been met or failures occur.
Additional Information
Terms & Conditions
Terms of Service
https://www.solarwinds.com/legal/termsPrivacy Policy
https://www.solarwinds.com/legal/privacyResources
SolarWinds® SQL Sentry - Performance Monitoring - Demo
SQL Sentry enables users to correlate events and perform root cause analysis of performance issues and job failures. It allows users to create their own Advisory Conditions ensuring you receive only important and unexpected alerts.
SolarWinds® SQL Sentry - How to Install SolarWinds SQL Sentry
This video shows you how to successfully install SolarWinds SQL Sentry, a powerful database performance monitoring solution designed to help you find and fix database performance problems—and prevent future challenges.
SolarWinds® SQL Sentry - Datasheet

SQL Sentry
$1,628.00Instance/Year $1,608.00Instance/Year For 5-9 Instances $1,592.00Instance/Year For 10-19 Instances $1,511.00Instance/Year For 20-29 Instances $1,432.00Instance/Year For 30-49 Instances $1,351.00Instance/Year For 50-74 Instances $1,272.00Instance/Year For 75-99 Instances $1,112.00Instance/Year For 100-199 Instances $858.00Instance/Year For 200-399 Instances $778.00Instance/Year For 400-599 Instances $690.00Instance/Year For 600-799 Instances $611.00Instance/Year For 800-899 Instances $523.00Instance/Year For 1000-1499 Instances $483.00Instance/Year For 1500-5000 Instances $419.00Instance/Year For 5001-9999 Instances $356.00Instance/Year For 10000-20000 InstancesSQL Sentry For Azure SQL DB
$180.00Instance/Year $1,608.00Instance/Year For 5-9 Instances $1,592.00Instance/Year For 10-19 Instances $1,511.00Instance/Year For 20-29 Instances $1,432.00Instance/Year For 30-49 Instances $1,351.00Instance/Year For 50-74 Instances $1,272.00Instance/Year For 75-99 Instances $1,112.00Instance/Year For 100-199 Instances $858.00Instance/Year For 200-399 Instances $778.00Instance/Year For 400-599 Instances $690.00Instance/Year For 600-799 Instances $611.00Instance/Year For 800-899 Instances $523.00Instance/Year For 1000-1499 Instances $483.00Instance/Year For 1500-5000 Instances $419.00Instance/Year For 5001-9999 Instances $356.00Instance/Year For 10000-20000 InstancesSQL Sentry
$1,628.00Instance/Year $1,608.00Instance/Year For 5-9 Instances $1,592.00Instance/Year For 10-19 Instances $1,511.00Instance/Year For 20-29 Instances $1,432.00Instance/Year For 30-49 Instances $1,351.00Instance/Year For 50-74 Instances $1,272.00Instance/Year For 75-99 Instances $1,112.00Instance/Year For 100-199 Instances $858.00Instance/Year For 200-399 Instances $778.00Instance/Year For 400-599 Instances $690.00Instance/Year For 600-799 Instances $611.00Instance/Year For 800-899 Instances $523.00Instance/Year For 1000-1499 Instances $483.00Instance/Year For 1500-5000 Instances $419.00Instance/Year For 5001-9999 Instances $356.00Instance/Year For 10000-20000 InstancesSQL Sentry For Azure SQL DB
$180.00Instance/Year $1,608.00Instance/Year For 5-9 Instances $1,592.00Instance/Year For 10-19 Instances $1,511.00Instance/Year For 20-29 Instances $1,432.00Instance/Year For 30-49 Instances $1,351.00Instance/Year For 50-74 Instances $1,272.00Instance/Year For 75-99 Instances $1,112.00Instance/Year For 100-199 Instances $858.00Instance/Year For 200-399 Instances $778.00Instance/Year For 400-599 Instances $690.00Instance/Year For 600-799 Instances $611.00Instance/Year For 800-899 Instances $523.00Instance/Year For 1000-1499 Instances $483.00Instance/Year For 1500-5000 Instances $419.00Instance/Year For 5001-9999 Instances $356.00Instance/Year For 10000-20000 InstancesPowered by WHMCompleteSolution
